
viz
viz builds plain dictionaries for a renderer you supply. It does not draw figures,
fit models, calculate feature importance or optimize portfolios. The
implementation
defines the payloads; tests
exercise every builder. Feature diagnostics uses
these builders in its reports; pipeline returns raw sequences
and frames that you can pass to them yourself.
Payload contracts
Section titled “Payload contracts”| Builder | chart | Data and behavior |
|---|---|---|
prepare_feature_importance_payload | bar | x names, y scores, optional error_y; descending importance, then top_n |
prepare_feature_importance_comparison_payload | grouped_bar | left and right, each with name, labels, values; input order retained |
prepare_drawdown_payload | line | Timestamp strings in x, original equity, computed drawdown |
prepare_regime_payload | line+step | x, score, threshold, regime; +1 at or above threshold, otherwise −1 |
prepare_frontier_payload | scatter | Volatility in x, return in y; optional Sharpe color |
prepare_cluster_payload | tree | node_id, parent_id; optional height |
All builders check corresponding sequence lengths and raise ValueError on mismatch.
They do not check that supplied statistics have economic meaning. Comparison series
are neither sorted nor aligned by label: their labels may deliberately differ.
Cluster parents are not checked against node IDs, and cycles are not rejected.
Sort scores while retaining their error bars
Section titled “Sort scores while retaining their error bars”from openquant.viz import prepare_feature_importance_payload
payload = prepare_feature_importance_payload( feature_names=["spread", "momentum", "vol"], importance=[0.20, 0.45, 0.35], std=[0.02, 0.05, 0.03], top_n=2,)print("chart:", payload["chart"])print("features:", payload["x"])print("importance:", payload["y"])print("error bars:", payload["error_y"])chart: barfeatures: ['momentum', 'vol']importance: [0.45, 0.35]error bars: [0.05, 0.03]The numbers here are illustrative inputs, not fitted importance estimates. Error
bars are passed through from std; the helper does not infer confidence intervals.
Use a positive top_n for an ordinary top-feature view and explicitly label the
importance method and uncertainty convention in your renderer.
Drawdown is relative to the running high
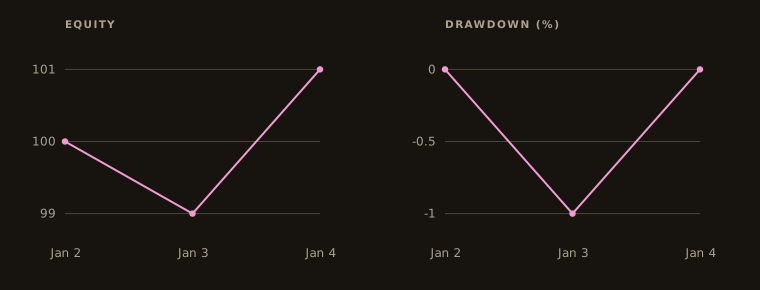
Section titled “Drawdown is relative to the running high”For positive equity, drawdown is equity / running_max(equity) - 1: zero at a new
high and negative below it. This is a fractional drawdown, not a currency loss or
a positive loss magnitude. The builder preserves row order, so sort and align the
inputs before calling it.
from openquant.viz import prepare_drawdown_payload, prepare_regime_payload
payload = prepare_drawdown_payload(    timestamps=["2024-01-02 16:00:00", "2024-01-03 16:00:00", "2024-01-04 16:00:00"],    equity_curve=[100.0, 99.0, 101.0],)print("equity:", payload["equity"])print("drawdown:", [round(value, 4) for value in payload["drawdown"]])print("first timestamp:", payload["x"][0])regime = prepare_regime_payload(["t1", "t2", "t3"], [0.3, -0.2, 0.0])print("regimes:", regime["regime"])
equity: [100.0, 99.0, 101.0]drawdown: [0.0, -0.01, 0.0]first timestamp: 2024-01-02 16:00:00regimes: [1, -1, 1]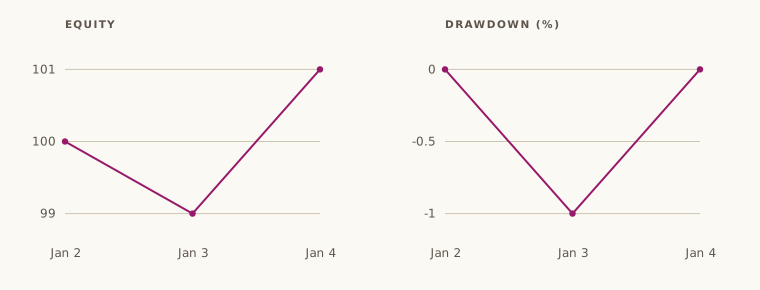
The drawdown builder parses timestamps with the shared data parser and stringifies
the results; a null parsed entry becomes the string "None". If no date format
can be inferred for the series, parsing can raise instead. The regime builder instead
passes timestamp labels through unchanged. These dictionaries are convenient chart
inputs, not a universal interchange schema: frontier labels are fixed to volatility
and return, and your plotting code must choose units, axes and formatting.
For frame construction and input-shape validation, see adapters.
API reference
Section titled “API reference”Python
Section titled “Python”Signatures, parameters, return values and errors for every function: openquant.viz.
viz.prepare_feature_importance_payload— Build a plotting-library-agnostic bar-chart payload for feature importances.viz.prepare_feature_importance_comparison_payload— Build a grouped-bar payload comparing two sets of importances.viz.prepare_drawdown_payload— Build a line-chart payload of an equity curve and its drawdown.viz.prepare_regime_payload— Build a line-plus-step payload of a regime score and the regime it implies.viz.prepare_frontier_payload— Build a scatter payload of an efficient frontier, optionally colored by Sharpe ratio.viz.prepare_cluster_payload— Build a tree payload (for example a dendrogram) from parent links.