
Runbook: bet sizing from predicted probabilities
Notebook: notebooks/python/13_bet_sizing_from_probabilities.ipynb,
committed with its outputs and executed in CI by just notebooks-run.
Module background: bet_sizing, evaluation,
cross_validation. Builds on
runbook 11.
Where the question comes from
Section titled “Where the question comes from”Runbook 11 trained a meta-model to decide whether to take a moving-average crossover’s bets. After seeing its results, it noticed that sizing the bets by the meta-model’s probability (Snippet 10.1) had done best: Sharpe ratio 1.28 on its headline path, and +0.36 over the unfiltered primary model in its Monte Carlo. It had not planned that comparison, so it labelled the result a candidate.
This runbook tests the candidate properly:
- Same pipeline. Runbook 11’s generator, primary model, meta-model and purged k-fold are copied unchanged.
- Fresh paths. Seed 50 instead of 47, so the test does not reuse the data the candidate was found on.
- Hypotheses written first. They and the trial grid were committed before the first run.
Hypotheses (pre-registered)
Section titled “Hypotheses (pre-registered)”The two rules share the same out-of-fold probability and both pay 5 bps per unit of one-way turnover:
- Filter: take the primary model’s bet at full size when (runbook 11’s rule).
- Sized: Snippet 10.1 with , floored at zero, then the average of live bets
(Snippet 10.2), rounded to steps of 0.1 (Snippet 10.3). This is
bet_sizing.bet_size_probability.
| Claim | Result | |
|---|---|---|
| H1 | At , sized has a higher net Sharpe ratio than filter (paired, 30 paths) | supported: 0.31 → 0.59, +0.27, = 7.0 |
| H2 | On a fresh headline path, sized’s DSR over all 21 trials is at least 0.95 | supported: DSR 1.000 (on a favourable path) |
| H3a | At , sized does not beat filter | passes: +0.01, = 0.4 |
| H3b | At , the best-of-grid DSR is ≥ 0.95 on at most 5% of paths | passes: 0 of 30 |
| H3c | On SYN_*, neither sized nor the best of the grid has DSR ≥ 0.95 | passes: 0.004 and 0.075 |
Method
Section titled “Method”- Probabilities. Runbook 11’s pipeline, unchanged:
- CUSUM events at 2σ;
- triple-barrier meta-labels at ±1.5σ, with a 14-day vertical barrier;
- three past-only features and average-uniqueness weights;
- an L2 logistic meta-model whose probabilities are out-of-fold from
cross_validation.purged_kfold_splits(5 folds, 1% embargo).
- Sizing rules. Every rule uses the same probabilities. With the primary model’s side and :
| Rule | Size of one bet |
|---|---|
fixed (primary) | |
binary (filter) | |
prob | |
prob-signed | : bets against the primary model when |
- From sizes to a position.
avg: the position is the mean size of the live bets (avg_active_signals, Snippet 10.2).latest: the position is the size of the most recently opened live bet.- Either way, the position is then rounded to the step (Snippet 10.3).
- The notebook asserts that
bet_size_probabilityequalsget_signal→avg_active_signals→discrete_signal.
- Returns. A position set at the close of bar earns bar , less 5 bps per unit of
turnover.
- The break-even cost is mean gross return divided by mean turnover.
- Maximum drawdown comes from
backtest_stats.drawdown_and_time_under_water.
- Trial grid: 21 configurations per path. Every one is recorded before any DSR is read:
- primary and filter;
probwith × step × {avg,latest};prob-signed;- the filter and the headline sized rule, walk-forward.
- No-bet trials. A trial that takes no position has constant returns and no Sharpe ratio.
TrialRegistry.recordstores it with a Sharpe ratio of 0 (#187), so it still counts toward the deflation; the Monte Carlo paths count it the same way.
Results (SYNTHETIC)
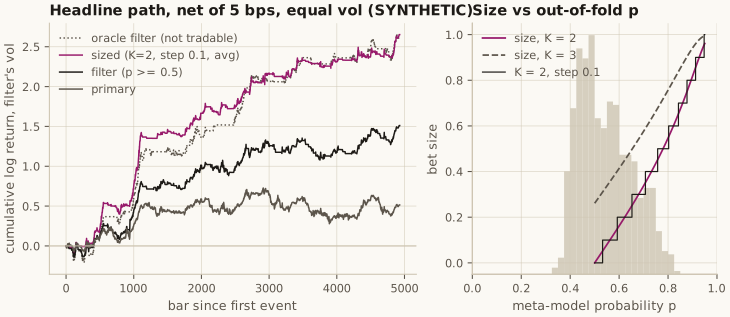
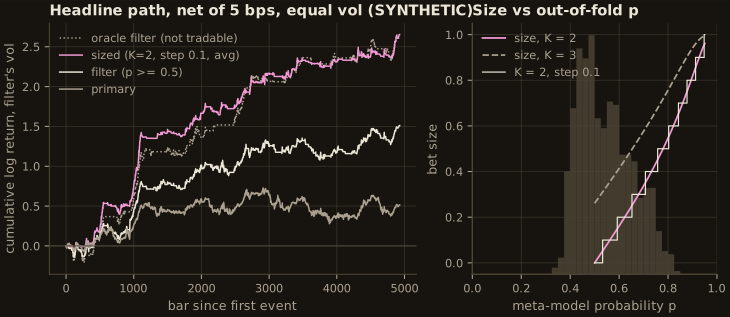
Section titled “Results (SYNTHETIC)”Headline path (fresh seed, 5,000 bars, 695 events, 21 trials, SR0 = 0.52 annualised):
| Rule | Bets | Net Sharpe (ann.) | Exposure | Turnover / day | Max DD | Break-even (bps) | DSR |
|---|---|---|---|---|---|---|---|
| Primary | 695 | 0.30 | 0.73 | 0.155 | 0.49 | 17 | 0.165 |
| Filter () | 402 | 0.78 | 0.43 | 0.100 | 0.24 | 38 | 0.870 |
| Sized ( = 2, step 0.1, avg) | 402 | 1.32 | 0.09 | 0.021 | 0.03 | 62 | 1.000 |
| Oracle filter (not tradable) | 314 | 1.31 | 0.37 | 0.074 | 0.16 | 53 | — |
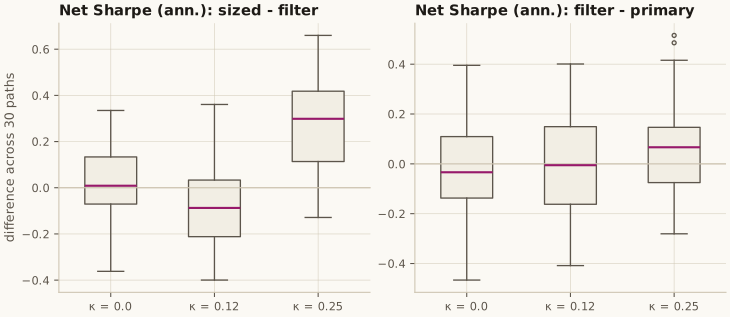
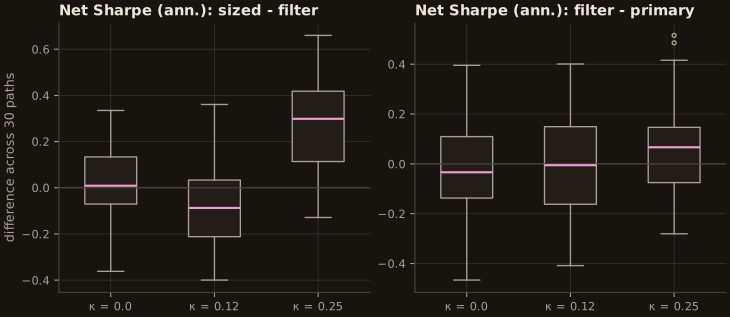
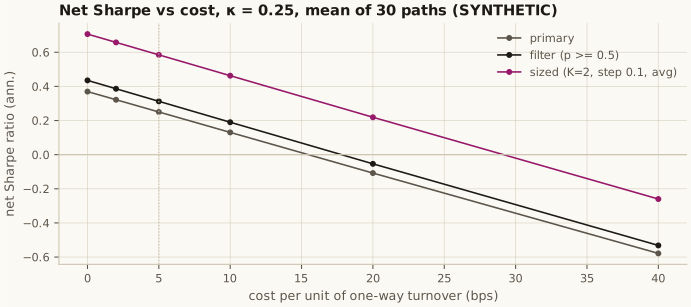
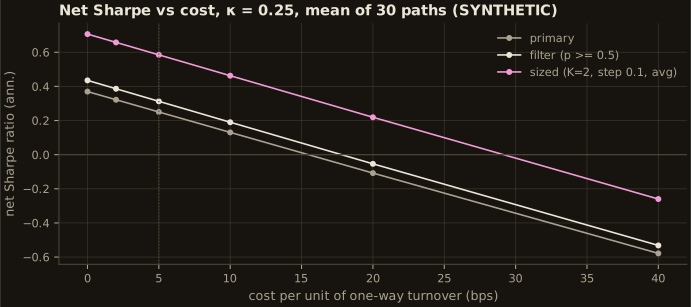
Monte Carlo, 30 fresh paths per strength (mean annualised net Sharpe ratio; paired difference, sized − filter):
| Primary | Filter | Sized | Sized − filter | Oracle filter | |
|---|---|---|---|---|---|
| 0 (no signal) | −0.19 | −0.20 | −0.18 | +0.01 ( = 0.4) | −0.19 |
| 0.12 | 0.06 | 0.05 | −0.03 | −0.08 ( = −2.4) | 0.38 |
| 0.25 | 0.25 | 0.31 | 0.59 | +0.27 ( = 7.0) | 1.18 |
What it means
Section titled “What it means”- The candidate replicates on fresh data. Sizing beats filtering by +0.27 of Sharpe ratio at the headline strength. Walk-forward, the gain is +0.19 ( = 4.3).
- The headline path is a good draw. Its DSR is 1.000, but only 11 of 30 paths at this strength give the sized rule a DSR of at least 0.95.
- Sizing amplifies what the meta-model knows, including nothing. At the meta-model has no detectable skill: the filter gains nothing over the primary model. There, sizing loses to filtering ( = −2.4). Size by probability only after the meta-model has shown skill.
- matters; step size and averaging did not, here.
- on a binary model gives every bet at least a 0.26 position, and scores 0.44 against 0.59.
- Steps from 0 to 0.2, averaged or latest-signal, all land within 0.585–0.612. Bets rarely overlap on this generator (mean uniqueness 0.87), so it cannot test averaging.
- Betting against the primary model when scores 0.47.
- Capacity. The sized book is small (exposure 0.075 against the filter’s 0.55). Its turnover per unit of exposure is about the same as the filter’s, and its break-even cost is higher (30 against 18 bps). Matching the filter’s risk needs about 5 to 7 times the position, which a nonlinear impact model could penalise. One synthetic asset with a linear cost cannot say.
- Controls. On the null paths no configuration, even the best of 21 picked after the fact,
reaches DSR 0.95. On
SYN_*every rule loses.
Decision
Section titled “Decision”Promote probability sizing as the default sizing stage after a meta-model that has shown skill; promote no strategy.
- What is promoted.
- Snippet 10.1 with equal to the number of classes, floored at zero (follow or stand aside).
- Averaging live bets and a 0.1 step, through
bet_size_probability. These are kept for the book’s reasons; they were not shown to help here. - Every sizing choice registered as a trial.
- Conditions.
- Gate on skill first: judge the filter against a null run, as runbook 11 requires.
- Report the break-even cost and exposure next to the Sharpe ratio.
- Not promoted. for a binary model, signed sizing, any claim about step size or averaging, and any market claim.
Checks
Section titled “Checks”The notebook asserts or prints all seven:
- Features, sides, volatility and events are unchanged when the future after a cut is replaced.
- Labels do not change when closes after change, and do change when closes inside the span change.
- Purged folds have zero train/test overlaps, and no embargoed event is trained on.
- A fold’s fitted model is bit-identical when its test fold is replaced with noise.
- For every
probconfiguration, positions up to each of 20 cuts are bit-identical when later probabilities and the ends of live bets are re-drawn. Re-drawing one live bet moves the position. - Shift test. Trading one bar early, which peeks, lifts the Sharpe ratio from 1.32 to 2.32. One bar late gives 1.20.
- Shuffle test. Permuting the probabilities across events gives a mean Sharpe ratio of 0.18, with a 95th percentile of 0.50. None of 200 permutations reaches 1.32.
Trial count. 21 per path, all deflated by. Two trials on null Monte Carlo paths took no position; they were counted with a Sharpe ratio of 0. The Monte Carlo paths, the cost sweep, the oracle, the shift and shuffle tests and the Snippet 10.4 illustration are not trials.
Illustration (not a hypothesis). The notebook also sizes the last six headline events from a
price forecast, using get_w, get_target_pos and the #163-corrected limit_price
(Snippet 10.4). The forecast is the expected barrier price implied by .
Audit: features with memory (#217)
Section titled “Audit: features with memory (#217)”This runbook fits runbook 11’s slowly varying meta features on purged folds, so it was checked
for the k-fold bias runbook 14 found
(cross_validation).
Its zero-signal paths already run through the same splits, k-fold and walk-forward: sized
beats the filter in neither (+0.01, = 0.4; walk-forward +0.03, = 0.8), and with the
signal walk-forward keeps a clear gain (+0.19, = 4.3). No conclusion changes.
Run it on your own data
Section titled “Run it on your own data”The control study reads three environment variables; the planted-signal study does not depend on the data source. Write the executed copy and figures outside the repository:
OPENQUANT_RUNBOOK_SOURCE=/path/to/daily_ohlcv.parquet \OPENQUANT_RUNBOOK_SYMBOLS=ES,NQ,CL \OPENQUANT_RUNBOOK_RANGE=2010-01-01:2024-12-31 \OPENQUANT_RUNBOOK_REGISTRY=$HOME/.openquant/trials-bet-sizing.json \OPENQUANT_FIGURE_DIR=/tmp/bet-sizing-figures \ uv run --python .venv/bin/python python notebooks/python/scripts/execute_notebook_cells.py \ notebooks/python/13_bet_sizing_from_probabilities.ipynb --out /tmp/13_on_my_data.ipynbOPENQUANT_RUNBOOK_REGISTRY keeps the control’s trial registry between sessions, so every sizing
configuration you try on your data counts toward its deflated Sharpe ratio. For a vendor API, set
SOURCE in the notebook’s parameters cell to an openquant.data.CallableSource.
OPENQUANT_RUNBOOK_REPS sets the number of Monte Carlo paths per strength (default 30).