
Runbook: HRP vs IVP and CLA out of sample
Notebook: notebooks/python/10_hrp_vs_ivp_cla_oos.ipynb,
committed with its outputs and executed in CI. Run it with
just notebooks-run --only 10; set OPENQUANT_RUNBOOK_RUNS=10000 for the book’s run count (CI runs
2,000).
Hypothesis
Section titled “Hypothesis”Under the Snippet 16.4 process (10 assets: 5 independent series plus 5 noisy copies, with common and specific shocks that fall out of sample), HRP’s out-of-sample portfolio variance is:
- H1: lower than CLA’s minimum-variance portfolio, and
- H2: comparable to or lower than inverse-variance weighting (IVP).
Each is tested on the per-run paired log variance ratio, one-sided at 5%.
Method
Section titled “Method”As in Snippet 16.5: at each rebalance, every 22 observations from row 260, estimate the covariance on
the previous 260 rows only, compute weights with
hrp.allocate_hrp, cla.allocate_cla
(solution="min_volatility"), IVP () and equal weight, and hold them for the
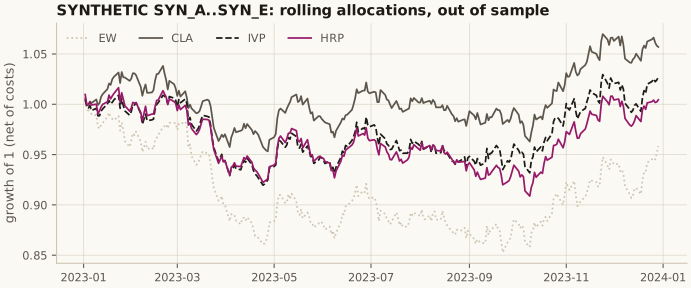
next 22 rows. Each run yields a 260-row out-of-sample series per method. A test cell checks that
replacing every row from the rebalance date on leaves the weights bit-identical. Costs: 10 bps per unit
of one-way turnover.
Result (2,000 runs, SYNTHETIC)
Section titled “Result (2,000 runs, SYNTHETIC)”| Method | Mean OOS variance ×10⁴ | Ratio to HRP | Runs where HRP is lower | Effective N (of 10) | Turnover per rebalance |
|---|---|---|---|---|---|
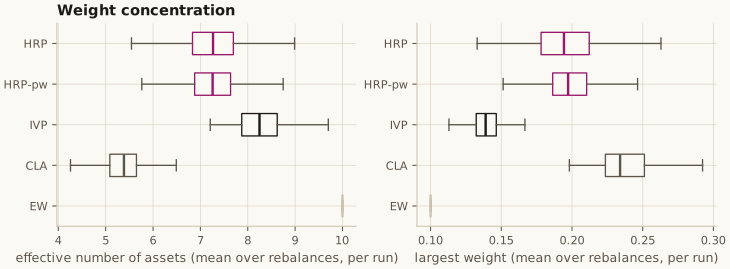
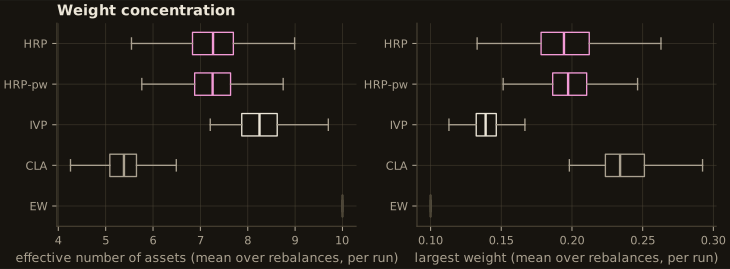
| HRP | 3.69 | 1.00 | — | 7.26 | 0.12 |
HRP on the pairwise tree (distance="correlation") | 3.90 | 1.06 | 53% | 7.25 | 0.22 |
| IVP | 5.01 | 1.36 | 83% | 8.26 | 0.07 |
| CLA (min. variance) | 5.16 | 1.40 | 64% | 5.36 | 0.19 |
| Equal weight | 8.42 | 2.28 | 89% | 10.00 | 0.00 |
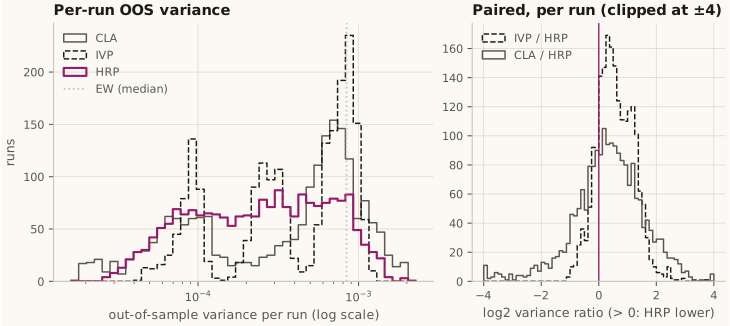
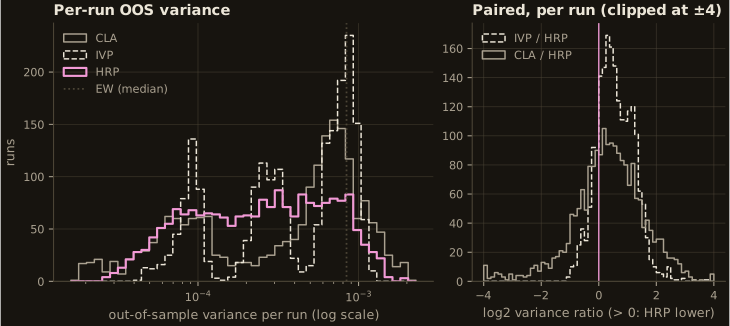
Both hypotheses are supported ( = 12.2 against CLA, 40.6 against IVP). A 10,000-run local run gives ratios of 1.42 (CLA) and 1.38 (IVP), with HRP lower in 65% and 83% of runs.
HRP here clusters as the book’s Snippet 16.4 does, on the distance between columns of the
correlation-distance matrix, which is openquant.hrp’s default since
#167. The second row is the tree it used before
(mlfinlab’s): about 6% more variance and nearly twice the turnover. At 10,000 runs its ratios are 1.30
(IVP) and 1.34 (CLA). See which distance is clustered.
Against the book
Section titled “Against the book”Quoting AFML §16.6 from memory (check the book before citing): CLA’s out-of-sample variance is about 72% higher than HRP’s and IVP’s about 38% higher. The direction replicates. With the book’s tree the IVP ratio matches too (1.38 at 10,000 runs, 1.36 at 2,000); the CLA ratio (1.42) is still smaller. On the statistic Snippet 16.5 appears to print (the variance across runs of each run’s standard deviation), CLA is 1.53× HRP and IVP 1.01×. Before #167, on the pairwise tree, the ratios were 1.30 and 1.34, and the tree was the largest candidate cause of the gap; the notebook lists what remains.
HRP turns over less than CLA (0.12 vs 0.19 per rebalance). On the pairwise tree it turned over more (0.22): single linkage on near-duplicate pairs reordered the leaves between windows. HCAA is left out; when this runbook was written it returned HRP’s weights exactly (#108).
Decision
Section titled “Decision”Replicated on synthetic data; not promoted as a market claim. Whether HRP lowers variance on a real universe is still open and needs this procedure run on real data.
Run it on your own data
Section titled “Run it on your own data”The notebook’s last study reads bars through openquant.data.fetch. Set these in its
setup cell:
from openquant.data import LocalFileSource
SOURCE = LocalFileSource("my_daily_bars.parquet")  # ts, symbol, close, ... one row per symbol and daySYMBOLS = ["AAA", "BBB", "CCC", "DDD", "EEE", "FFF"]START, END = "2015-01-02", "2024-12-31"
A vendor client can be wrapped in openquant.data.CallableSource instead (see DATA_SOURCES.md). One
path over a handful of assets is an illustration, not evidence: a real study needs tens of assets, many
years, and its trial count recorded.
SYN_A..SYN_E sample: one path, no inference.