
Runbook: fracdiff, stationarity versus memory
Notebook: notebooks/python/09_fracdiff_stationarity_memory.ipynb,
committed with its outputs and executed in CI by just notebooks-run. Module background:
fracdiff.
Hypothesis
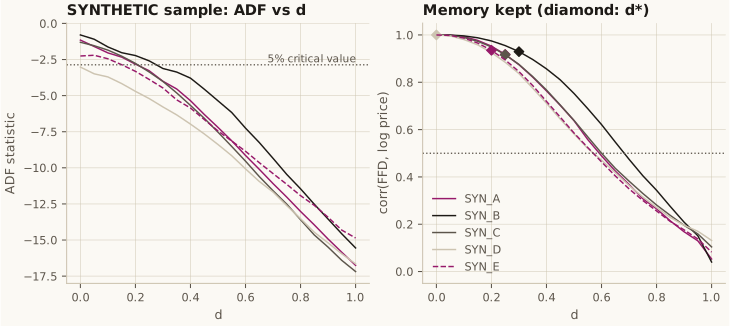
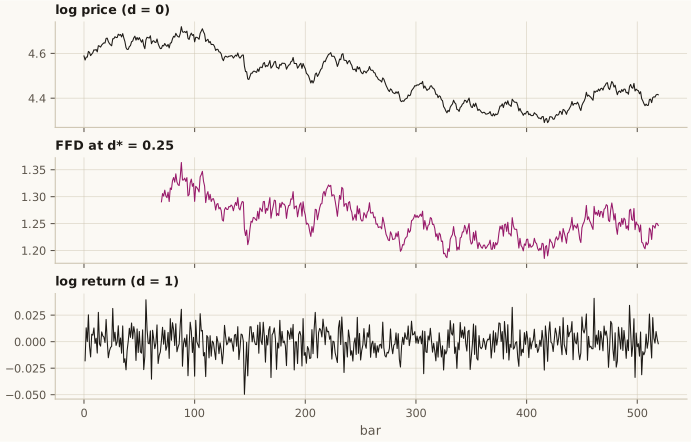
Section titled “Hypothesis”H1. For each series there is a minimum at which the fixed-width-window fractionally differenced (FFD) log price rejects a unit root (ADF, constant, one lag, 5%), and at that the FFD series still correlates at least 0.5 with the log price. This is the AFML Fig. 5.5 claim. The threshold of 0.5 was fixed before the first run.
Theory gives a known answer to check against. A series that is fractionally integrated of order , differenced times, is stationary only once . For a random walk () that means .
Method
Section titled “Method”- Grid: (21 values). FFD by
openquant.fracdiff.frac_diff_ffdwiththresh = 1e-3(Snippet 5.3). - ADF: , the statistic is
, and the 5% critical value comes from MacKinnon’s (2010) finite-sample surface. This
is Snippet 5.4’s
adfuller(maxlag=1, regression="c", autolag=None), written in numpy becausestatsmodelsis not a dependency. It matchesstatsmodelsto 1e-12. - Memory: the Pearson correlation between the FFD series and the log price.
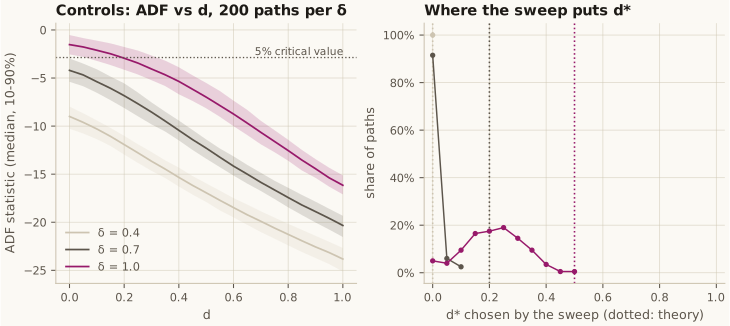
- Controls: 200 simulated paths each of fractionally integrated noise with , 520 bars like the sample, run through the same sweep.
- Checks: chosen on the first half and tested on the second; a shift test showing that no FFD output changes when later bars are replaced.
Results
Section titled “Results”| Symbol | corr at | corr at (returns) | FFD weight sum at | H1 | |
|---|---|---|---|---|---|
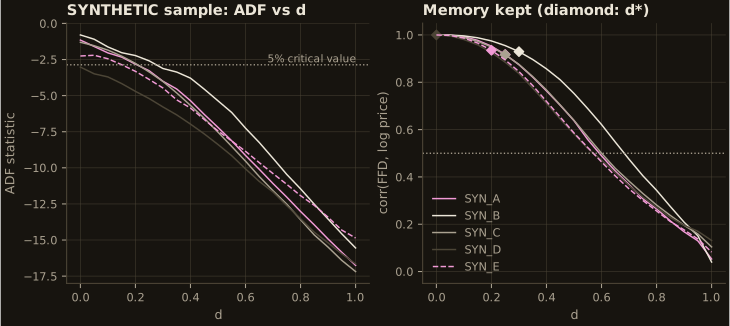
SYN_A | 0.25 | 0.918 | 0.053 | 0.28 | supported |
SYN_B | 0.30 | 0.929 | 0.040 | 0.22 | supported |
SYN_C | 0.25 | 0.916 | 0.104 | 0.28 | supported |
SYN_D | 0.00 | 1.000 | 0.131 | 1.00 | supported |
SYN_E | 0.20 | 0.935 | 0.082 | 0.37 | supported |
The rule is then run on the controls, where the right answer is known:
| theory | median | below theory | same, ADF with 5 lags | |
|---|---|---|---|---|
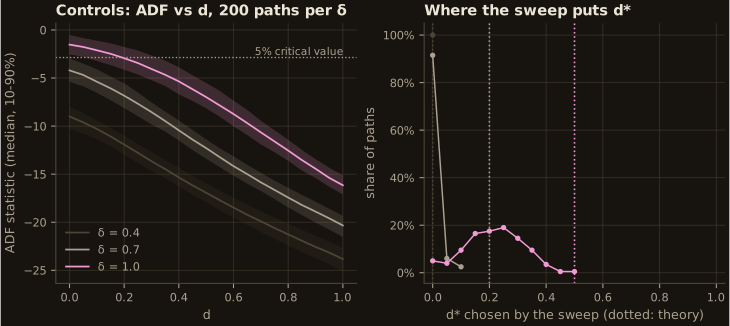
| 0.4 | 0.0 | 0.0 | 0% of paths | 0% |
| 0.7 | 0.2 | 0.0 | 100% | 92% |
| 1.0 | 0.5 | 0.2 | 99.5% | 88% |
What it shows
Section titled “What it shows”- H1 passes as written, on 5 of 5 symbols.
SYN_Dpasses at , which for a random walk is a 5% false rejection. - Passing ADF does not mean the series is stationary. ADF’s null hypothesis is a unit root. A series integrated of order between 0.5 and 1 has no unit root, so ADF rejects, but it is still not stationary. On random walks the rule therefore picks -, where theory needs more than 0.5, on 199 of 200 paths.
- Part of the retained memory is the level itself. At
thresh = 1e-3the truncated weights at sum to 0.22-0.37 instead of 0, so a fifth to a third of the log price passes through the filter unchanged. - is noisy. Compared with the full sample, a sweep on the second half alone moves for three of the five symbols, by up to 0.25.
- No look-ahead. No FFD output changes when later bars are replaced.
Promotion decision
Section titled “Promotion decision”Do not promote. Later runbooks should not use “per-symbol = the smallest passing ADF”
as their default feature transform. Keep frac_diff_ffd as a candidate feature, with chosen
on the training span and counted as a trial. If is chosen by a test, pair ADF with a test whose
null is stationarity (KPSS or similar). Report the FFD weight sum next to any FFD feature. Issue
#49’s other question, whether FFD features beat returns in a purged-CV classifier net of costs,
needs real data or a planted signal. This runbook does not test it;
runbook 14 does, on a planted signal, and does not
promote them either.
Run it on your own data
Section titled “Run it on your own data”The notebook reads three environment variables. Write the executed copy and its figures outside the repository:
OPENQUANT_RUNBOOK_SOURCE=/path/to/daily_ohlcv.parquet \OPENQUANT_RUNBOOK_SYMBOLS=ES,NQ,CL \OPENQUANT_RUNBOOK_RANGE=2015-01-01:2024-12-31 \OPENQUANT_FIGURE_DIR=/tmp/fracdiff-figures \ uv run --python .venv/bin/python python notebooks/python/scripts/execute_notebook_cells.py \ notebooks/python/09_fracdiff_stationarity_memory.ipynb --out /tmp/09_on_my_data.ipynbFor a vendor API, set SOURCE in the notebook’s parameters cell to a CallableSource around
your own fetch function. Read your table next to the controls table: the controls do not
depend on your data, and they show how far below the stationarity boundary the ADF rule tends to
land.
Reproducibility
Section titled “Reproducibility”The notebook’s last cell prints the package version, the dataset_hash of the sample
(sha256:b311c219…), the hash of the simulated controls, the seed (49) and the trial counts: 105
(symbol, ) evaluations on the data, 210 more for the half-sample re-sweeps, and 25,200 on the
simulations, which describe the method and select nothing. It also prints the git commit, to
stderr. The trial registry (openquant.evaluation) is not on this branch yet, so the counts are
recorded in the notebook’s run manifest.